I created the layout and design of this report along with all illustrations and icons for infographics. The cover and some other elements were guided by the Mandiant brand standards. I designed the cover to have a shiny on dull varnish so that the small squares were only visible as a shine on the cover.
You may also like
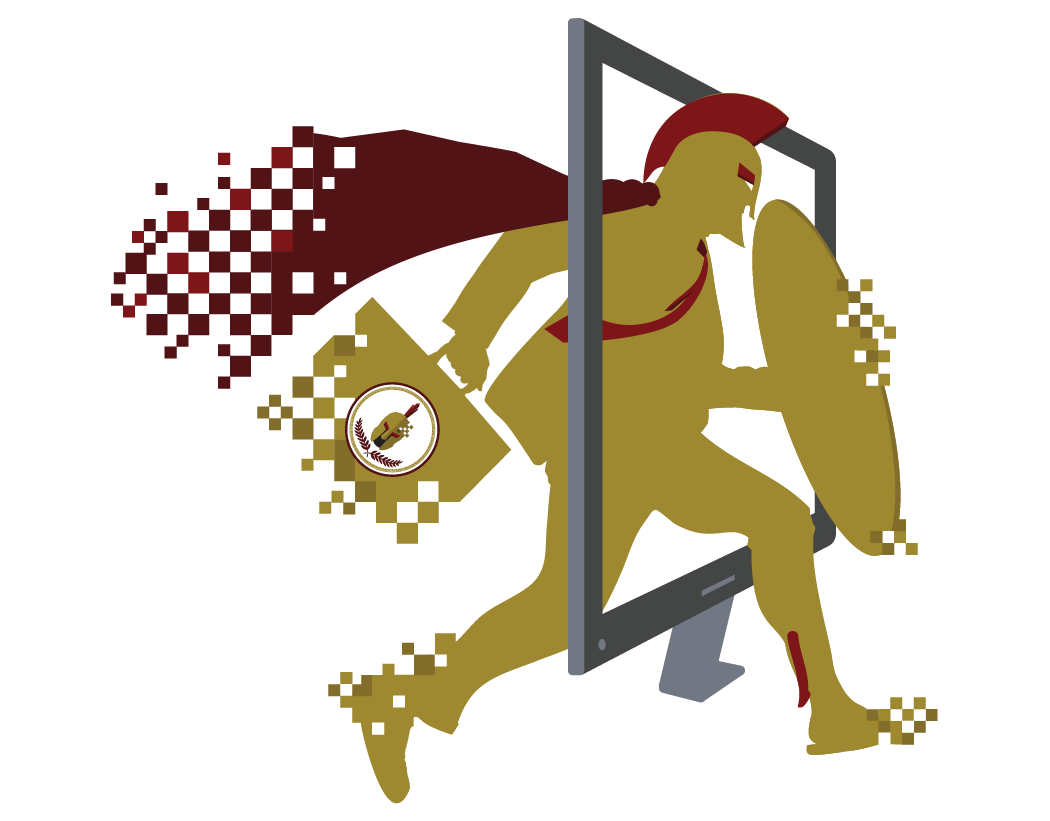
Cyber Warrior infographics
2017

Report with Infographics
2016
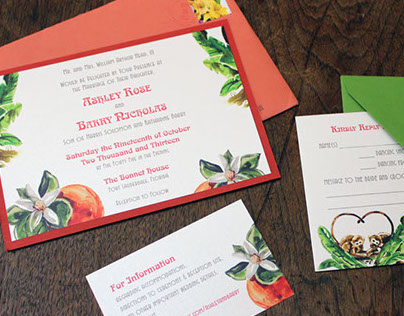
Wedding Invitation
2013

Annual GAP Report
2017
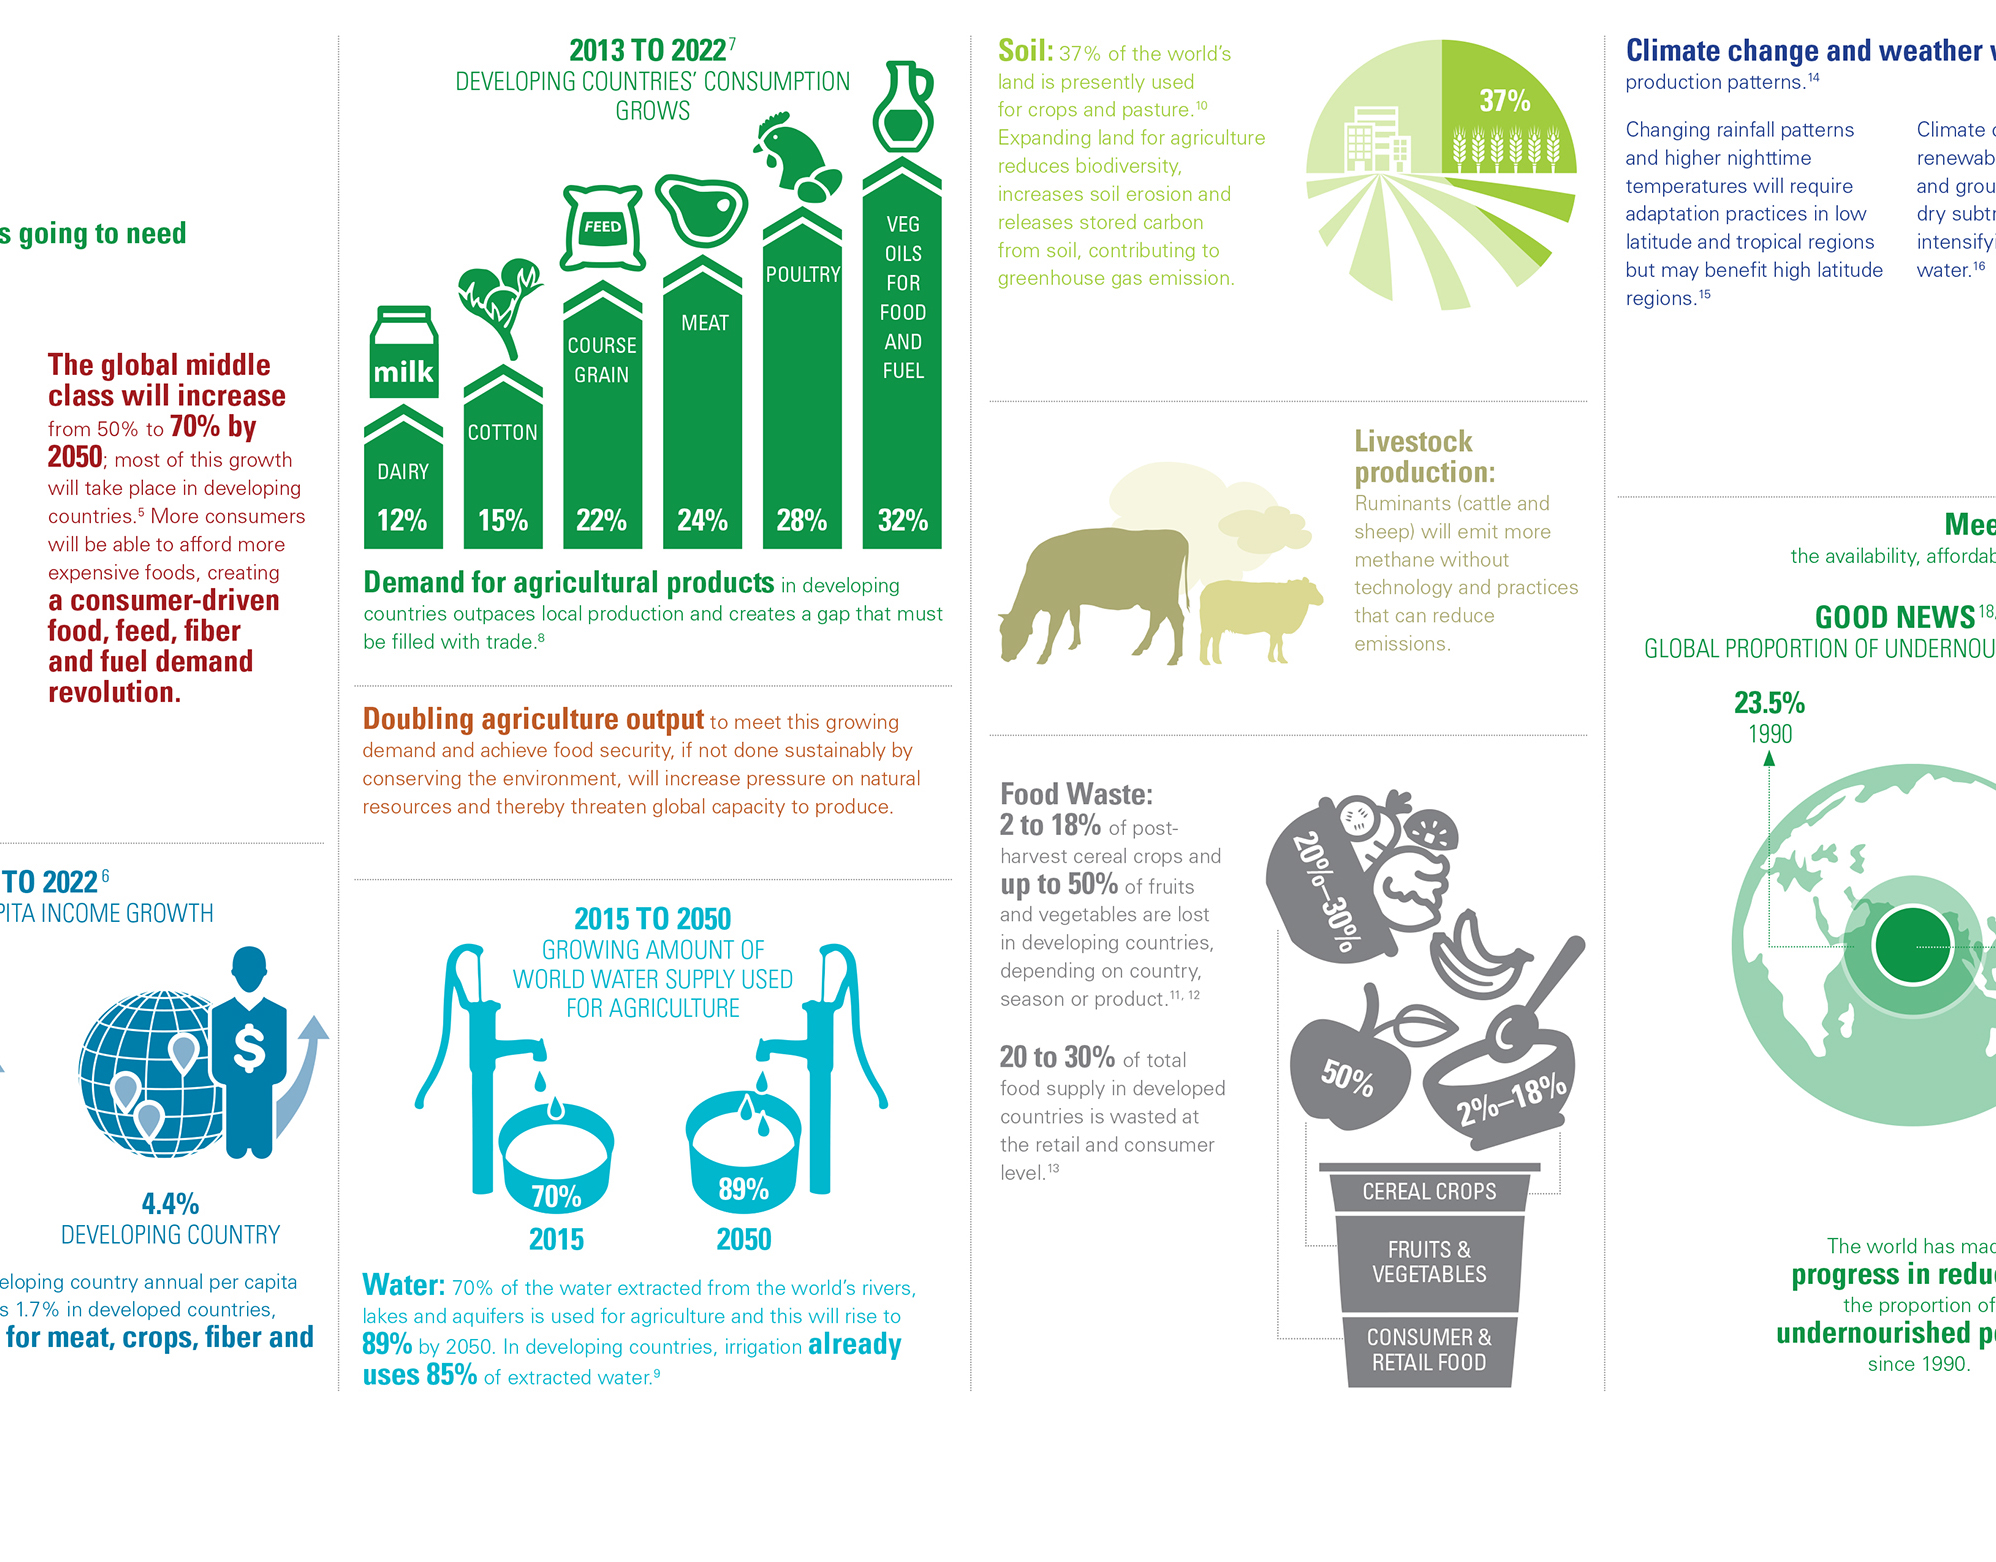
2015 GAP Report — MarCom Platinum Winner
2015

Scale Illustrations
2014

Transforming Teams Book Illustrations
2015
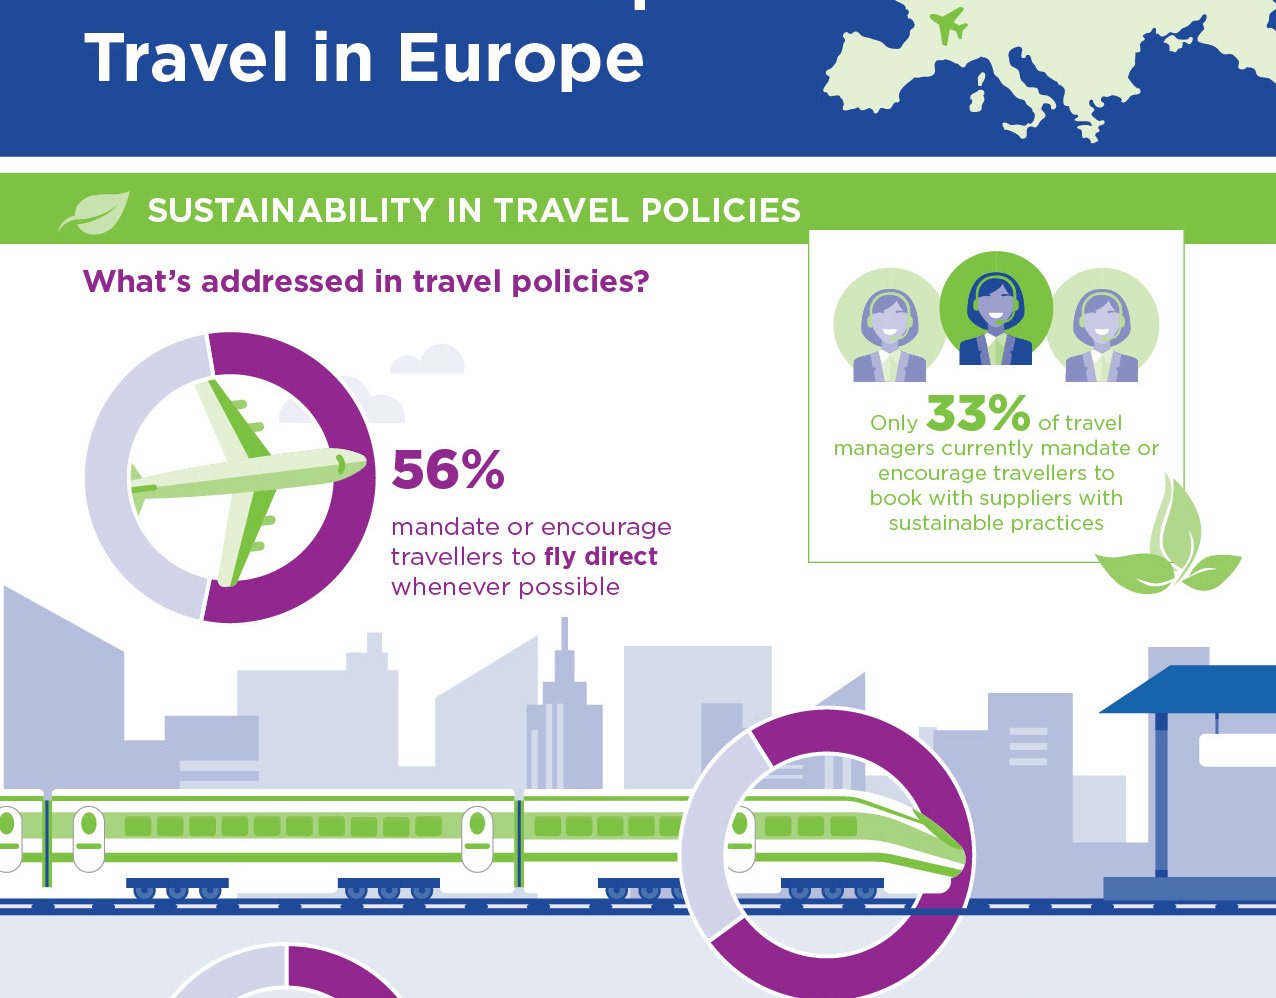
Global Business Travel Association Infographics
2020

Business Portrait Illustrations
2014

GAP report infographics
2014
